Everything you see out there, remembered
Not just ducks, fish and birds: any sighting, tagged your way, with the conditions stapled on automatically — and a chart per tag on the other end.
- Step 1 · The idea
Step 1 of 6. A notebook for everything that isn’t a catch
You see things out there that are not fish in the net or birds in the bag: elk on a bench, a grizzly track in a sandbar, the first big push of pintails, a hopper bank going off, morels in an old burn.
An Observation bookmarks the sighting — what, where, when, how many — in two taps. It is not a duck feature or a fish feature. It is a field notebook for anything with a where and a when.
→NextHere is what makes it more than a note.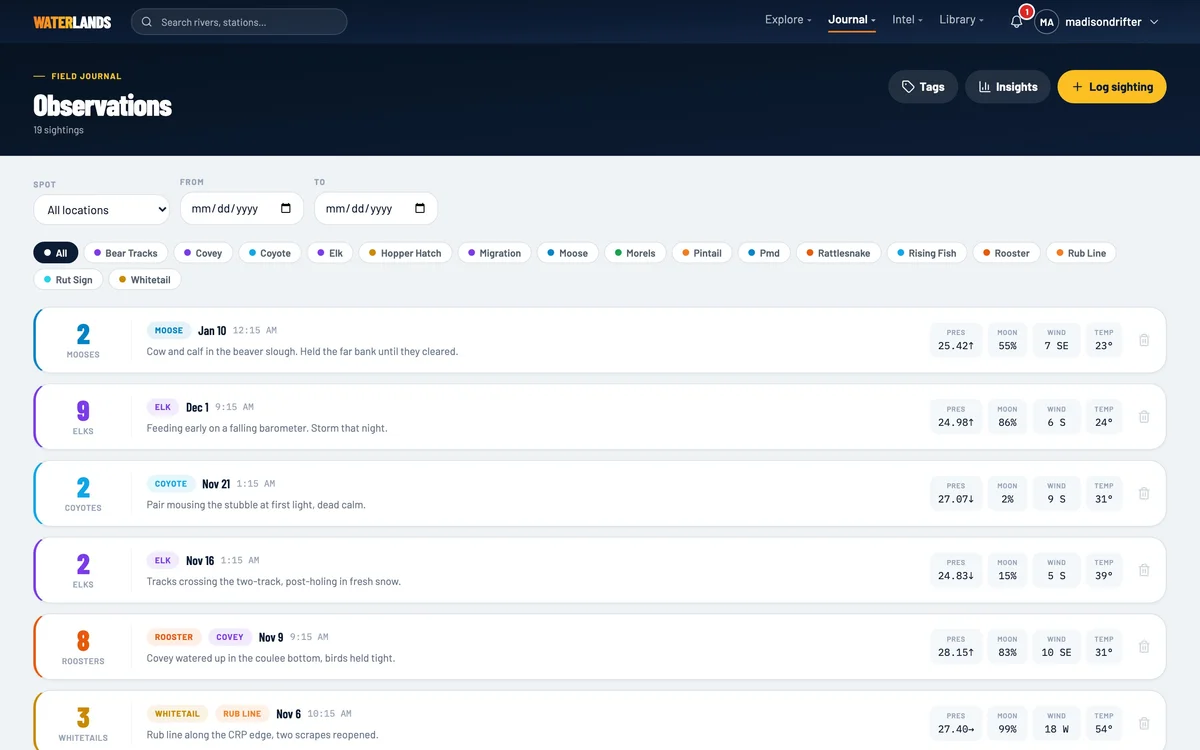
- Step 2 · Logging
Step 2 of 6. Tag it, count it, drop it
A new Observation takes a tag or two, an optional count or activity level, a note if you want one, and the pin — from where you stand or wherever you tap on the map. You can back-date one from the truck that evening.
Tags are free text. Type anything: rattlesnake, rub line, shrimp run, first frost. The taxonomy is yours, and the next step is why that matters.
→NextThe moment you save, the real work happens.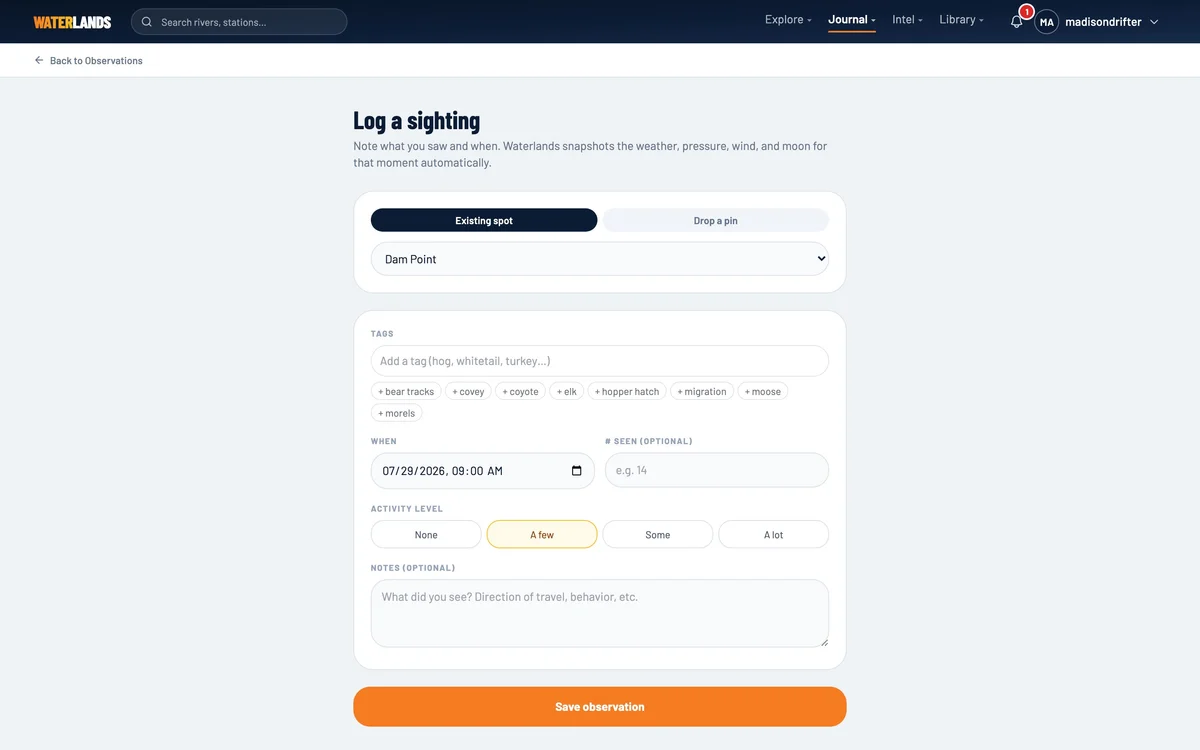
- Step 3 · The trick
Step 3 of 6. Every sighting gets the conditions stapled to it
The instant an Observation saves, Waterlands snapshots the conditions at that pin and that minute: temperature, wind, pressure and its twelve-hour trend, cloud, precipitation, moon phase and solunar period. Back-dated entries get the archive weather for the time you actually saw it.
You wrote "6 elk, bench above the river." The record says it was 28 degrees, falling pressure, a north wind, and a waning moon. You will care about the difference in about ten sightings.
→NextYour tags become your taxonomy.Zero typingStapled to every row
Temperature · wind · pressure + 12h trend · cloud · precip · moon + solunar — captured automatically for the sighting’s exact time and place, even back-dated.
- Step 4 · Tags
Step 4 of 6. Your words, organized your way
The tag manager turns your pile of free-text tags into a taxonomy: a color per tag, and scopes like Big game, Sign & safety, Bugs & hatches, Foraging — whatever cuts your world the way you think about it.
Nobody ships you a species list. A guide tracks rub lines and bear sign; a flats guide tracks shrimp runs and glass minnows; somebody tracks morels and will not say where. All of those are first-class here.
→NextAnd then the payoff.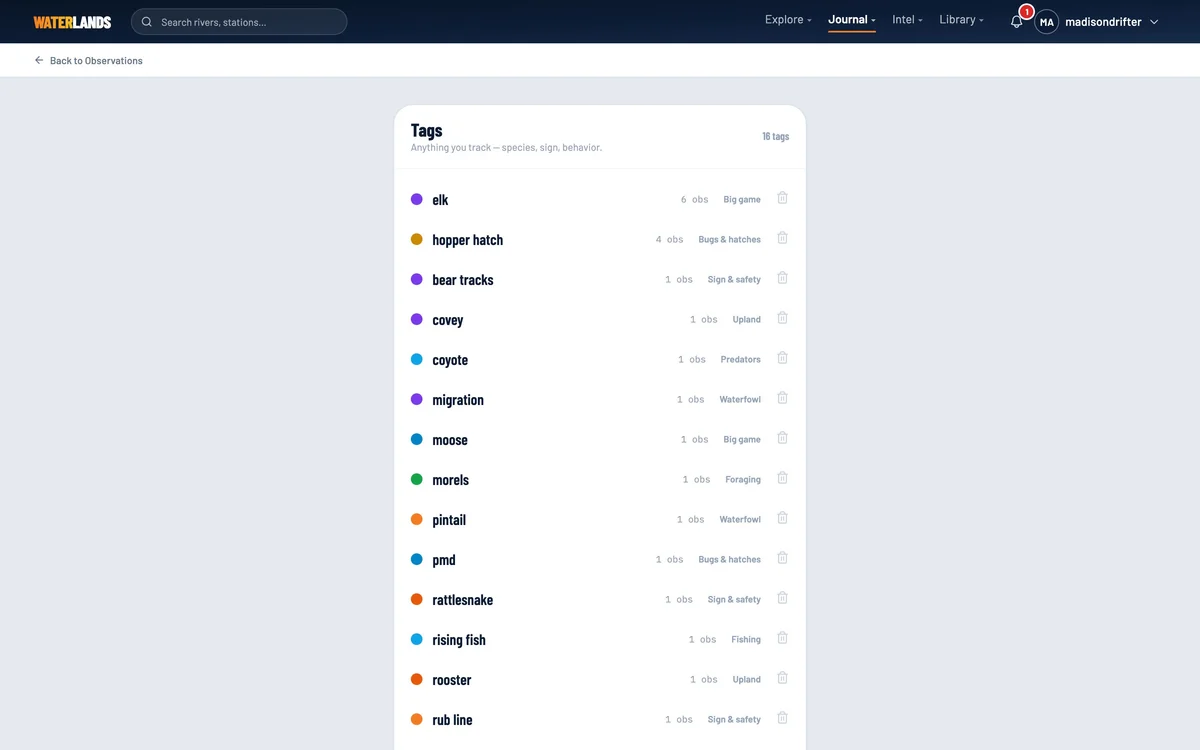
- Step 5 · The payoff
Step 5 of 6. Pick a tag, see its pattern
The Insights view takes any tag and lines your sightings up against the conditions that were stapled to them: sightings by temperature, by wind, by pressure trend, by moon, by season.
Ten elk observations become "you see elk moving on falling pressure after the first cold snap" — not as folklore, as your own dots on a chart. The hopper tag learns that the bank dies under a cold front. Every tag earns its own pattern.
TipCounts and activity levels feed the charts. "4 elk" beats "elk" — the magnitude is what turns dots into a trend.→NextAnd it stays yours.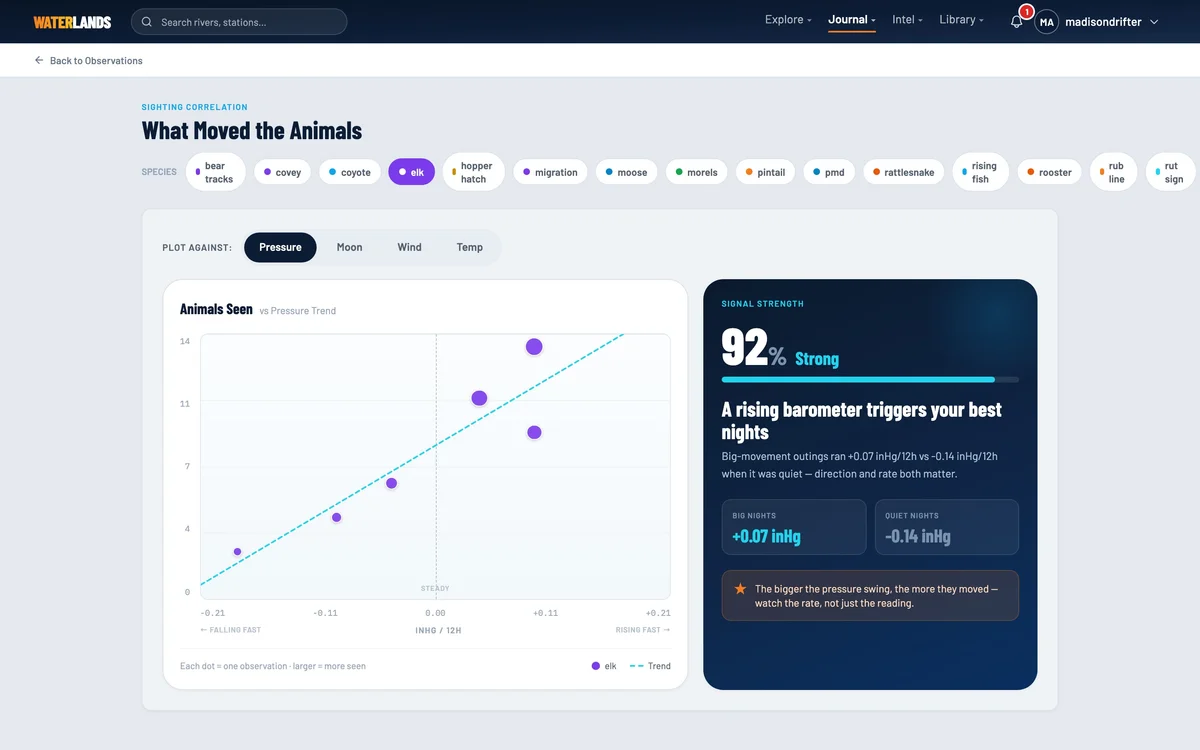
- Step 6 · Privacy
Step 6 of 6. The notebook is yours alone
Observations are private to your account. Not shared, not aggregated into anyone else's map, not sold. The elk bench and the morel burn stay where they belong.
They sit alongside your sessions in the same system — so the same app that scores your fishing holds the field notebook for everything else you know about your country.
Private by defaultWhere it fits
Observations ride the same conditions engine as sessions and Reads. One system, one map, one owner: you.